Showing posts with label Data Science. Show all posts

Sunday, March 13, 2016

Learning from the LearningIsEarning2026 future forecaster game

Earlier this week I participated in a future forecasting event run by the Institute for the Future. The game was hosted online at http://www.learningisearning2026.org and lasted 36 hours. From 9AM CST on Tuesday until 9PM CST on Wednesday. The event coincided with the SXSWEdu conference and so part of the game was unveiled live at that event and then driven through Twitter using specialized hash-tags.

The game started with a teaser that you can view. It's only 6 minutes and it is embedded in the main page. What you learn is that in the future, 10 years from now, education is something that is tracked publicly through a block chain system like the one that powers Bitcoin. You are able to learn in many different ways and gain Edublocks from companies, universities and even other individuals. I won't spoil the video, please go watch it!

Play


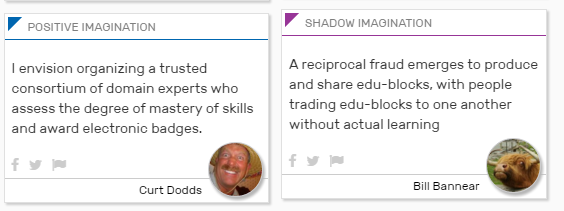
To play you sign in and you play cards in the form of 140 characters of thought. There are two primary cards that you can play in the beginning - "Positive Imagination" and "Shadow Imagination". These are for playing your ideas for how you see the future playing out under these new conditions. You can play positive things you'd like to see happen in Positive Imagination and you play more negative things that you fear might happen and you wish to avoid in the Shadow Imagination.


Once you've played a few cards, you'll start to gain points. Not by playing the card, but by others building on your card. They can either like your card giving you points or they can build on your card expounding on your original idea in four different ways.

First they can "Predict" by building on your future and saying how this will evolve. You can imagine a number of prediction cards building on one another to reach farther and farther into the future. Predict cards are about the future and they allow you to be creative within the constraints of the game.

The second card is an Act card. This is a card you play that allows you to describe ideas that will either make the future more likely for positive futures or less likely in case of shadow futures. Act cards are about the now and allow you to use your existing skills and thoughts to help describe how to make these futures come to be.


The third card you can play is a Cheer card. This allows you to agree with the person. Why do you like or not like this future. This allows you to dog-pile on top of someone's existing ideas and add weight. It also lets them know they are on to something. Cheer cards are about agreement within the system.

The final card you can play is an Investigate card. This allows you to ask a question about the card someone played. You can either delve in deeper on what they are saying, choose to use a question to force them to reflect on their original ideas or just get clarification since maybe the idea was unclear. Investigate cards reflect our desire to disagree and discuss ideas that rub us the wrong way.


Once a build is started with either of the two imagination cards, they can then be built upon with any of the four remaining cards. These cards can in turn be played on one another. This means some positive or negative potential outcome is the root of every build and you have many tools with which you can respond and interact with that original idea.

Gamification


For this the gamification comes in the form of a leaderboard and scoring system. Rather than repeat the scoring system, here is the system as defined on the site when you click on your points.


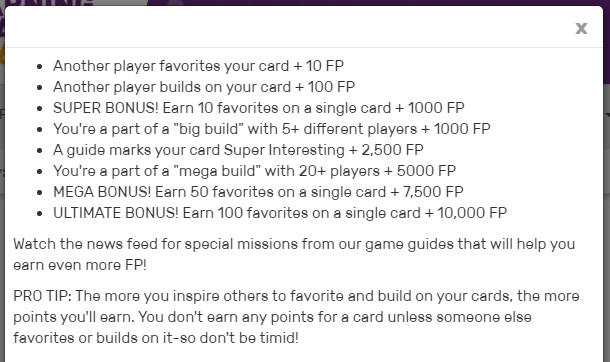
You quickly find out that you don't get points for playing cards. You get points when people favorite or like your card. Further, you learn that if another player extends your card then you get some points. Larger point values are awarded on milestones when your cards either get heavily favorited by others OR they like your idea and create really large builds. For instance, a "mega build" which includes more than 20+ players gets a cool 5000 points. Turns out this is for good reason too, since it was REALLY hard to get a mega build. There may have only been 2 or 3 the entire game.

The next thing you learn is that by getting points you level up. Certain point values will get you to the next level, where you'll receive super powers that you can use within the game, or even better, real life rewards. Some of the rewards were quite compelling to gamers like myself. For instance, at 75,000 points you got invited to future events. Of course every gamer wants to be invited to future tournaments! At 100,000 you get invited to a special discussion group on IFTF.org. There were only 4 of us in the entire event to get this award level, making it fairly prestigious.

Finally we learn that the game engineers did a good job of setting bounds. There are also awards at 250k, 500k, 750k, and 1 million. However, these were never achieved. Doing so would have required some very intense collaborative efforts by a set of gamers focused on slightly bending the rules and relying on something called boosting. We'll get more into that later ;-)

Each level came with a name. Keen, Bright, up to Legendary. These gave you some idea of how much value the designers gave to each point series. Expert was at the 250k mark and nobody reached it ;-) For me it was a goal only to achieve the 75k to get future invitations. By the end though, I had achieved nearly 120k after making some adaptations to my play style.

Meta Game


There were a couple of interesting meta games happening during the event. The first was something that I noticed which I cannot fully verify, but maybe the game creators will come along and agree. It seemed there were some players from the IFTF that maybe were playing super powers that they didn't get from leveling up. If they weren't doing this, then they could have been (and maybe should have been) to help keep the game more interesting and breath air into dead zones.

The second meta game was the Twitter angle. During the SXSWEdu keynote there was a call to arms to play the game by submitting tweets with certain hash-tags. These became cards in the system. However, they also became the largest grouping of completely unseen cards on which nobody was able to build or play. When analyzing the data set it was a stream of nearly 2000 singular cards. It is possible that they came in too fast for others to play on. Its also possible their quality was being driven without access to the cards already played in the game and thus they lacked the same level of foresight and thought as those who had spent hours on the site collaborating with others.

Whatever the reason I think that the second meta game failed. Even textual analysis of the cards showed that they were divergent and disconnected from the main game.

Gaming the Game


This was the fun part for me. At the end of the first day I was setting in 4th place and I had a pretty decent score. I knew that I wouldn't have much time to play on the second day. It was, after all, during the middle of the work week and I had a lot of great stuff to deliver.

I decided that there were two ways to increase my points. The first was to get more people to favorite my cards. This would come naturally if I had good ideas, so this wasn't worth trying to min/max within the system. The second scoring mechanism was being part of builds. This, is directly related to my own actions and not the actions of others. This was the perfect mechanic to focus on. And note, I'm saying focus on. I in no way tried to manipulate the game for points. Instead I focused on responding and replying to threads which had more relevance to me both in terms of content and potential points.

What I needed here was a way to examine the entire graph. The game itself only showed the top 20 most active futures and I was already involved in all of those. I needed the graph for thousands of ideas and builds (to view use the Open In feature, the graph is too large to be previewed by Dropbox). I started by making page requests, which contained no data. The pages were dynamic and thus the cards are populated by script after the fact. I then looked at the network traffic. They had obfuscated the traffic well enough that I didn't want to spend my time trying to reverse engineer it.

What I knew was that I was logged in and I could see all of the pages and data. I wrote a scraper that would navigate the pages and extract the content. In the process it would build the entire graph of ideas and it would alert me to graphs which I was not participating in, but that I should be participating in because the content was interesting.

Nearing the end of the event, I had scraped nearly 7000 cards and had a big enough graph that I could make my final push. Using this technique I was able to find hundreds of threads I had missed while sleeping and allow myself to come up to speed on them. I was also able to identify places where people had asked investigate cards of me that I had in turn missed. But those are questions and I wanted to try and reply to all of the questions I could.

All of this min/max work I did with only hours to go, but it taught me a lot about the game itself and potentially how to improve it.

Learning from the Game


This game taught me a ton about gamifying abstract concepts. I was truly drawn in and the idea was very intriguing. The low barrier to entry, just 140 characters, made it accessible to a large group of people. In fact by the end there were more than 2000 registered players though I don't think everyone got a chance to submit a card.

Normally games have very clear goals and scoring but this game was highly abstract and was about something that may never even happen. What value is gleaned from the cards played are really up to the players and game organizers. What can be learned from the experience has either already been learned or will be further analyzed post mortem by organization and reorganizing the cards into different structures.

Seeing this highly abstract game play out made me realize that these are the tools I needed to figure out how to change teams and organizations. Like this future concept we often work in futures when at work. We are always estimating our ability to deliver a future that may or may not happen. Having people collaborate using this structure is leaps and bounds more enabling than simpler approaches like polls, planning exercises and other games where the results are immediately available and describe concrete results.

Equally there is a lot to be learned about what the game might have gotten wrong. Let's explore that next.

Improving the Game


After developing my own tools to learn more about what was happening in the system a few inspiring ideas fell out that I think may improve the game. Some of these I found during the event and reached out to the coordinators, but I doubt there was any time available to be able to adapt the game to take them into account.

Let's start with the full graph of the system. This was my way to find interesting threads, but it could have been built into the game itself. Not being able to see all of the information that was going by meant that I was restricted to the tools given to me by the game. This was the Dashboard, which showed the most recent 30 or so cards with interesting things happening. This information was quickly consumed though and there was so much that never showed up in the Dashboard but was still very, very interesting.

I can think of several ways to build this. First, a bigger graph view that allowed exploration of more of the cards than the top 20 builds. These top 20 builds were established early on, in the first day and rarely changed.

A simple search would have been great as well. Searching for specific keywords could have enabled players who wanted to participate in certain types of conversations to focus their engagements. After all not everyone has unlimited time.

A final set of tools for finding cards of interest. For instance, showing me all cards that build on mine that I haven't yet seen or replied to. This would have hopefully made bigger more engaging builds. A random card tool could have augmented this in order to surface some of the cards that nobody had seen or replied to.

Many of these features could have even been promoted with points. Why not give an extra 5 or 10 points to being the first reply on a card that nobody has responded to yet. This would have enabled explorers within the system to seek out and engage under represented topics.

And on that topic, the handling of the Tweet cards I believe was one of the most disappointing findings of the entire event. When I discovered 2000 unseen cards with no replies, a statistical anomaly in the data set, it made me quite sad. I'm sure this was hard to foresee in the games construction, but now that we know that it exists we could avoid it. Perhaps just by focusing more on the visibility of these cards or by improving the interaction model so that anyone who tweeted was drawn into future game interactions rather than sending one-offs into the system.

My next finding is also related to improving engagement. Throughout the event ideas continuously got repeated. This is a good thing and a bad thing. First, why is it good? Well, it allows people to newly engage on prior ideas without feeling that all of the ground has been covered. This can mean that people who came in late still feel like valuable conversation is happening. Additionally you collect more data on the repeat ideas. Higher counts means more people care about that aspect of the space and you can use this to focus later games and efforts.

It can be bad because we naturally want to group and organize the graphs and prevent duplication. However, there was no way to do this within the system. No way to point users at previous posts other than to copy/paste links to the original cards. Eventually this broke down completely since nobody could find related card links to cross/post. As the game grew near the end the information got more and more unorganized and the pace picked up substantially. This actually showed up in the build graphs as deeper builds in the beginning of the event, the sea of singular tweet cards in the middle and finally very shallow and broad graphs at the end (where everyone replied many times to a top card, but never following a long train of thought).

Conclusions


I think the game was very successful overall. It definitely accomplished what it set out to do and brought awareness to an abstract concept, engaging hundreds if not thousands of people on a false future that may or may not ever come even close to true.

I look forward to participating in future games, perhaps even helping with the design and technology behind them. I definitely think I can provide more value by building and facilitating than by simply participating.

After the event I also completed my scraper so it could get more than just the card graph. I improved it to get all of the information on the card that wasn't related to scoring and made it available on Github as JSON. You can view the repository containing the raw card data.

You can also play around with the data a bit. I made a tag cloud visualization for the players. Using this you can see how the various players were focusing their efforts. For fun, I've included my tag cloud here. I spent a lot of time trying to be in character referring to "The Ledger" and "Edublocks" :-)


Saturday, February 27, 2016

Improving Web Performance with Data Science and Telemetry

This post is about our ongoing commitment to using telemetry, data science, testing and solid engineering to achieve great results for the web. Over the course of two prior posts we've covered a 3 day hackathon in which we built DOM profiling data into the core of our browser to figure out how web authors really use our stuff. I then circled back on how we took the hack and built it into a world class telemetry pipeline, at web scale, so we could validate our local findings on the entire web ecosystem. Now I'm going to walk you through how we took a single, unexpected insight and turned it into a great product improvement.

The Insight

Insight #2: Our crawler data only had about a 60-70% overlap with our live data. This meant that what people do on the web changes quite a bit between their initial navigates and when they start to interact with the page. Our crawler was blind to big sites where people spend a lot of time and do a lot of interactions. All of those interactive scenarios were only "marginally" hit by the crawler.
This means that some APIs not on our performance optimization list started to jump up the list and became important for our team. We also started to extrapolate use cases from the data we were seeing. As an immediate example, APIs like setTimeout started to show up more since that is how dynamic pages are written. requestAnimationFrame was the same. All of the scheduling APIs moved up the list a bit when we considered the live data and presented differently than the crawler did. This was great news.
So this insight is taken from our follow-up on building the telemetry pipeline which could sample profile the entire population of EdgeHTML users to figure out the key APIs we should be focusing more testing, functionality and performance improvements on. We also hope to recommend API deprecation in the future as well, based on lack of hits on some set of APIs. That could prove huge.

How bad was setTimeout in terms of global usage? Well, it looked to be close to 15% of the time scripts were spending in the DOM (numbers are approximate). It was so heavyweight that it could be up to 2x the next closest API, which tends to be something related to layout such as offsetWidth or offsetHeight. This data was quite interesting but also very confusing. While the call counts were exceptionally high, there were other APIs that were also just as high. Also, the call counts on offsetWidth and offsetHeight were also no joke.

Once we knew that a problem existed it was time to figure out why and what we could do. There were two approaches, the first of which was to improve the telemetry. In addition to time spent in the API we decided to collect the timeout times and information about parameter usage. Our second approach was to write some low level tests and figure out the algorithmic complexity of our implementation vs other browsers. Was this a problem for us or was it a problem for everyone?

The Telemetry


Telemetry is never perfect on the first go round. You should always build models for your telemetry that take into account two things. First, you are going to change your telemetry and fix it. Hopefully very quickly. This will change your schema which leads to the second thing to take into account. Normalization across schemas and a description of your normalization process is critical if you want to demonstrate change and/or improvement. This is most telemetry, but not all. You could be doing a one shot to answer a question and not care about historical or even future data once you've answered your question. I find this to be fairly and if I build temporary telemetry I tend to replace it later with something that will stand the test of time.

The first bit of telemetry we tried to collect was the distribution of time ranges. The usage of 0, 1-4, 4-8, etc... to figure out how prominent each of the timeout and intervals ranges was going to be. This got checked in relatively early in the process, in fact I think it may be having a birthday soon. This told us that storage for timers needed to be optimized to handle a LOT of short term timers, meaning they would be inserted and removed from the timeout list quite often.

Once we started to see a broad range in the call times to setTimeout though we wanted to know something else. The API takes a string or function. A function doesn't have to be parsed, but a string does. We optimize this already to parse on execute, so we knew that string vs function wasn't causing us any differences in time to call setTimeout for that reason, however, the size of the structure to hold these different callback types was impacted, as was the time it takes to stringify something from JavaScript into a more persistent string buffer for parsing.

We also, per spec, allow you to pass arguments to the callback. These values have to be stored, maintained by GC relationships to the timeout, etc... This is yet more space. We knew that our storage was sub-optimal. We could do better, but it would cost several days of work. This became another telemetry point for us, the various ranges of arguments.

This telemetry is likely in your build of Windows if you are an Insider running RS 1. So you are helping us make further improvements to these APIs going forward. Telemetry in this case is about prioritization of an unlimited amount of work we could do based on real world usage. It helps ensure that customers get the best experience possible even if they don't understand the specifics of how browsers implement various HTML 5 APIs.

The Tests


Sometimes it is just faster to write a test and explore the space. After an hour of brainstorming and guessing (yes computer scientists like to imagine how the code should work and then make guesses about why it doesn't work that way, it is one of our most inefficient flaws ;-) we decided to write some tests. This is where Todd Reifsteck (@ToddReifsteck) stepped in and built a very simple, but compelling test to show the queueing and execution overhead across increasingly large workloads. Original GitHub File or run it from RawGIT here, though I've embedded it as a Gist below.

This test showed that Internet Explorer was using a back-end that demonstrated quadratic performance as the number of timers grew. EdgeHTML inherited this same implementation and though we knew about the problem, it had been reported by several customers, it was not actually a problem on the web. It was more of a website bug that led to very large numbers of timers being present and eventually the browser slowed down.

More telling though was that even at very low numbers EdgeHTML was some ways from Chrome and FireFox. This meant that not just our storage issues were in question, but we also had some nasty overhead.

The Numbers


When we first collected the numbers it was very obvious that something needed to be fixed. The legacy implementation had clearly been optimized for a small number of timeouts and our algorithms had significant warm-up costs associated with the 10 timer loop that weren't present in other browsers.

Internet Explorer/Microsoft Edge (Before)
Iterations Scheduling Time Execution Time Comments
10 8.5ms 8.5ms Warm Up
100 0.7ms 1.2ms
1000 6.4ms 28ms
10000 322ms 1666ms

Chrome (32-bit)
Iterations Scheduling Time Exec Time
10 0.01ms 0.01ms
100 0.39ms 0.5ms
1000 3.6ms 5.3ms
10000 38ms 45ms

From the list you can clearly see that Chrome has pretty much a linear ramp in both scheduling and execution. They also have no warm-up associated costs and seems almost ridiculously fast for the 10 iterations case.

It turns out that the quadratic algorithm was impacting both scheduling and execution. It was precisely the same helper code that was being called in both circumstances. Eliminating this code would be a huge win. We also had more than one quadratic algorithm so there was a hefty constant (you normally ignore the 2 in 2n^2, but in this case it was important, since to get not n^2 both of the algorithms had to be removed).

Removing those and we were within the ballpark of Chrome before we accounted for our compiler optimizations (PGO or Profile Guided Optimization) which would take weeks to get. We wanted to know we were close so we looked for a few more micro-optimizations and there were plenty. Enough that we now have a backlog of them as well.

Microsoft Edge (64-bit)
Iterations Scheduling Time Exec Time Comments
10 0.28ms 0.06ms Warm Up
100 0.22ms 0.46ms
1000 1.8ms 4.4ms
10000 16.5ms 70.5ms GC

We still have some sort of warm-up costs and we have a weird cliff at 10000 timers during execution where the GC appears to kick in. I can't do the same analysis for FireFox, but they also have some weird cliffs.

FireFox
Iterations Scheduling Time Exec Time
10 0.41ms 0.05ms
100 0.90ms 0.24ms
1000 7.75ms 2.48ms
10000 109ms 21.2ms

Scheduling they seem to be about 2x Chrome and Edge is now 0.5x Chrome (Caveat: My machine, Insider Build, etc...) They clearly have less overhead during execution of the callbacks though, generally coming in at 0.5x Chrome on that front. And they have something similar to Edge when they first start to run timers.

Conclusion


Hopefully this articles ties together all of our previous concepts of telemetry, data science and prioritization and gives you an idea of how we are picking the right things to work on. Preliminary telemetry from the build on which I collected the numbers above do indeed show that Microsoft Edge has a marked reduction in the time spent scheduling timers. This is goodness for everyone who uses Edge and authors who can now rely on good stable performance of the API even if they are slightly abusing it with 10k timers ;-)

In my teaser I noted some extreme improvements. Using the slightly rounded numbers above and the worst cases Edge is now 3-30x faster at scheduling timers depending on how many timers are involved. For executing timers we are anywhere from 3-140x faster.

With this release all modern browsers are now "close enough" that it doesn't matter anymore to a web page author. There is very little to be gained by further increasing the throughput of more empty timers in the system. Normally a timer will have some work to do and that work will dwarf the amount of time spent scheduling and executing them. If more speed is necessary, we have a set of backlog items that would squeeze out a bit more performance that we can always toss on the release. However, I recommend writing your own queue in JavaScript instead, it'll be much faster.

Tuesday, December 29, 2015

Progress Towards a Fully Tested Web API Surface Area

Back in September I was amazed by the lack of comprehensive testing present for the Web API surface area and as a result I proposed something akin to a basic surface level API suite that could be employed to make sure every API had coverage. Since that time a lot of forward progress has occurred, we've collected a bunch of additional data and we've come up with facilities for better ensuring such a suite is complete.

So let's start with the data again and figure out what we missed last time!

Moar Data and MOAR Test Suites

Adding more test suites is hopefully going to improve coverage in some way. It may not improve your API surface area coverage, but it may improve the deep usage of a given API. We originally pulled data from the following sources:
  1. Top 10k sites - This gives us a baseline of what the web believes is important.
  2. The EdgeHTML Regression Test Suite - By far the most comprehensive suite available at the time, this tested ~2500 API entry points well. It did hit more APIs, but we excluded tests which only enumerated and executed DOM dynamically.
  3. WebDriver Enabled Test Suites - At the time, we had somewhere between 18-20 different suites provided by the web community at large. This hit ~2200 APIs.
  4. CSS 2.1 Test Suite - Mostly not an OM test so only hit ~70 APIs
Since then we've added or improved the sources:
  1. Top 100k sites - Not much changed by adding sites.
  2. Web API Telemetry in EdgeHTML - This gave us a much larger set of APIs used by the web. It grew into the 3k+ range!! But still only about 50% of the APIs we export are used by the Web making for a very large, unused surface area.
  3. DOM TS - An internal test suite built during IE 9 to stand up more Standards based testing. This suite has comprehensive depth on some APIs not tested by our other measures.
  4. WPT (Web Platform Tests) - We found that the full WPT might not be being run under our harnesses, so we targeted it explicitly. Unfortunately, it didn't provide additional coverage over the other suites we were already running. It did end up becoming part of a longer term solution to web testing as a whole.
And thanks to one of our data scientists, Eric Olson, we have a nice Venn Diagram that demonstrates the intersection of many of these test suites. Note, I'm not including the split out WPT tests here, but if there is enough interest I can probably try to see if we can try a different Venn Diagram that can include more components or rework this one and pull out an existing pivot.


Since this is so well commented already, I won't go into too much, but I'll point out some key data points. The EdgeHTML DRTs have a lot of coverage not present in any public suites. That is stuff that is either vendor prefixed, MS specific or that we need to get into a public test suite. It likely requires that we do some work, such as conversion of the tests to test-harness.js before that happens, but we are very likely to contribute some things back to the WPT suite in the future. Merry Christmas!?!

We next found that the DOM TS had enough coverage that we would keep it alive. A little bit of data science here was the difference between deleting the suite and spending the development resources to bring it back and make it part of our Protractor runs (Protractor is our WebDriver enabled harness for running public and private test suites that follow the test-harness.js pattern).

The final observation to have is that there are still thousands of untested APIs even after we've added in all of the coverage we can throw together. This helped us to further reinforce the need for our Web API test suite and to try and dedicate the resources over the past few months to get it up and running.

WPT - Web Platform Test Suite

In my original article I had left out specific discussions of the WPT. While this was a joint effort amongst browsers, the layout of the suite and many aspects of its maintenance were questionable. At the time, for instance, there were tons of open issues, many pull requests, and the frequency of updates wasn't that great. More recently there appears to be a lot of new activity though so maybe this deserves to be revisited as one of the core suites.

The WPT is generally classified as suite based testing. It is designed to be as comprehensive as possible. It is organized by specification, which arguably means nothing to web developers, but does mean something to browser vendors. For this reason, many of the ad-hoc and suite based testing which was present in the DRTs, if upgraded to test-harness.js, could slot right in. I'm hopeful that sometime after our next release we are also able to accompany it with an update for WPT that includes many of our private tests so that everyone can take advantage of the collateral we've built up over the years.

Enhancing the WPT with this backlog of tests, and potentially increasing coverage by up to ~800 APIs, will be a great improvement I think. I'm also super happy to see so many recent commits from Mozilla and so many merge requests making it back into the suite!

Web API Suite

We still need to fix the API gap though and so for the past couple of months we've (mostly the work of Jesse Mohrland, I take no credit here) been working on a design which could take our type system information and automatically generate some set of tests. This has been an excellent process because we've now started to understand where more automatically generated tests can be created and that we can do much more than we originally thought without manual input. We've also discovered where the manual input would be required. Let me walk through some of our basic findings.

Instances are a real pain when it comes to the web API suite. We have about 500-600 types that we need to generate instances of. Some may have many different ways to create the instances that result in differences of behavior as well. Certainly creating some elements will result in differences in their tagName, but they may be of the same type. Since we are an API suite we don't want to force each element to have its own suite of tests, instead we focus on the DOM type and thus we just want to test 1 instance generically and then run some other set of tests on all instances.

We are not doing the web any service by only having EdgeHTML based APIs in our list. Since our dataset is our type system description, we had to find a way to add unimplemented stuff to our list. This was fairly trivial, but hasn't yet been patched into the primary type system. This has so many benefits though. Enough that I'll enumerate them in a list ;-)

  1. We can have a test score the represents even things we are missing. So instead of only having tests for things that exist, we have a score against things we haven't implemented yet. This is really key towards having a test suite not just useful to EdgeHTML but also to other vendors.
  2. True TDD (Test Driven Development) can ensue. By having a small ready-made basic suite of tests for any new APIs that we add, the developer can check in with higher confidence. The earlier you have tests available the higher quality your feature generally ends up being.
  3. This feeds into our other data collection. Since our type system has a representation of the DOM we don't support, we can also enable things like our crawler based Web API telemetry to gather details on sites that support APIs we don't yet implement.
  4. We can track status on APIs and suites within our data by annotating what things we are or are not working on. This can further be used to export to sites like status.modern.ie. We don't currently do this, nor do we have any immediate plans to change how that works, but it would be possible.
Many of these benefits are about getting your data closer to the source. Data that is used to build the product is always going to be higher quality than say data that was disconnect. Think about documentation for instance which is built and shipped out of a content management system. If there isn't a data feed from the product to the CMS then you end up with out of data articles for features from multiple releases prior, invalid documentation pages that aren't tracking the latest and greatest and even missing documentation for new APIs (or removing documentation for dead APIs).

Another learning is that we want the suite to be auto-generated for as many things as possible. Initial plans had us sucking in the tests themselves, gleaning user generated content out of them, regenerating and putting back the user generated content (think custom tests written by the user). The more we looked at this, the more we wanted to avoid such an approach. For the foreseeable future we want to stop at the point where our data doesn't allow us to continue auto-generation. And when that happens, we'll update the data further and continue regenerating.

That left us with pretty much a completed suite. As of now, we have a smallish suite with around 16k tests (only a couple of tests per API for now) that is able to run using test-harness.js and thus it will execute within our Protractor harness. It can trivially then be run by anyone else through WebDriver. While I still think we have a few months to bake on this guy I'm also hoping to release it publicly within the next year.

Next Steps

We are going to continue building this suite. It will be much more auto-generated than originally planned. Its goal will be to test the thousands of APIs which go untested today by more comprehensive suites such as WPT. It should test many more thousands of unimplemented APIs (at least by our standards) and also some APIs which are only present in specific device modes (WebKitPoint on Phone emulation mode). I'll report back on the effort as we make progress and also hope to announce a future date for the suite to go public. That, for me, will be an exciting day when all of this work is made real.

Also, look out for WPT updates coming in from some of  the EdgeHTML developers. While our larger test suite may not get the resources to push to WPT until after our next release I'm still hopeful that some of our smaller suites can be submitted earlier than that. One can always dream ;-)

Friday, December 25, 2015

Web API and Feature Usage - From Hackathon to Production

I wanted to provide some details on how a short 3 day data science excursion has lead to increased insights for myself, my team and eventually for the web itself.

While my original article focused on hardships we faced along the way, this article will focus more on two different topics that take much longer than 3 days to answer. The first topic is around how you take your telemetry and deliver it at web scale and production quality. You can see older articles from Ars Technica that have Windows 10 at 110 million installs back in October. That is a LOT of scale. The second topic I want to discuss are the insights that we can gather after the data has been stripped of PII (personally identifiable information).

I'll start with a quick review of things we had prior to Windows 10, things we released with Windows 10 and then of course how we released DOM API profiling in our most recent release. This later bit is the really interesting part for me since it is the final form of my Hackathon project (though in full transparency, the planning for the DOM telemetry projected preceded my hackathon by a couple of months ;-)

Telemetry over the Years

The concepts of getting telemetry to determine how you are doing in the wild is nothing new. And Web Browsers, Operating Systems and many other applications have been doing it for a long time. The largest scale telemetry effort (and probably the oldest) on Windows is likely still Watson. We leverage Watson to gain insights into application and OS reliability and to focus our efforts on finding and fixing newly introduced, crashing and memory related bugs.

For the browser space, Chrome has been doing something with use counters for a while. These are great, lightweight boolean flags that get set on a page and then recorded as a roll-up. This can tell you, across some set of navigations to various pages, whether or not certain APIs are hit. An API, property or feature may or may not be hit depending on user interaction, flighting, the user navigating early, which ads load, etc... So you have to rely on large scale statistics for smoothing, but overall this is pretty cool stuff that you can view on the chrome status webpage.

FireFox has recently built something similar and while I don't know exactly what they present, you can view it for yourself on their telemetry tracking page as well.

For Microsoft Edge, our telemetry over the years has been very nuanced. We started with a feature called SQM that allowed us to aggregate user information if they opted into our privacy policies. This let us figure out how many tabs you use on average, which UI features were getting clicks and a small set of other features. These streams were very limited in the amount of data we could send and so we were careful not to send up too much.

With Windows 10 we started to lean more on a new telemetry system which is based on ETW (Event Tracing for Windows) which gives us very powerful platform that we were already familiar with to log events not just in our application, but across the system. The major improvements made here were how we extended our existing page load and navigation timings so that we could detect very quickly whether or not we had a performance problem on the web without having to wait for users to file a bug for a site and then up-vote it using our various bug reporting portals.

Just doing something we already had in our back pockets from previous releases would have been boring though, so we decided that a boolean flag based structure, logged per navigation would also give us a lot of extra data that we could use to determine feature popularity within the browser itself. While annotating every DOM API would be overkill for such an effort, given there are 6300 of them in our case, of which nearly 3000 are in general usage on the web, we instead saved this for larger feature areas and for exploring APIs in depth. This functionality shipped in our initial release of Windows 10 and we've been steadily adding more and more telemetry points to this tracker. Many of which are mirrored in the Chrome data, but many of which are more specific to our own operations or around features that we might want to try and optimize in the future.

This puts the web in a great place. At any given point in time you have hundreds if not thousands of active telemetry points and metrics being logged by all of the major browser vendors, aggregating and gaining insight across the entire web (not just a single site and not just what is available to the web site analytics scripts) and being shared and used in the standards process to help us better design and build features.

Building a Web Scale Telemetry System

I don't think a lot of people understand web scale. In general we have trouble, as humans, with large numbers. Increasingly larger sequences tend to scale much more slowly in our minds than in reality. My favorite book on the subject currently escapes my mind, but once I'm back at my desk at home I'll dig it out and share it with everyone.

So what does web scale mean? Well, imagine that Facebook is serving up 400 million users worth of information a day and imagine that they account for say, 5% of the web traffic. These are completely made up numbers. I could go look up real numbers, but let's just hand wave. Now, imagine that Internet Explorer and Microsoft Edge have about 50% of the desktop market share (again made up, please don't bust me!) and that accounts for about 1.2 billion users.

So Facebook's problem is in that they have to scale to deliver data to 400 million users, but a lot more than say our telemetry would be, and they account for 5% of all navigations. Let's play with these numbers a bit and see how they compare to the browser itself. Instead of 400 million users, let's say we are at 600 million (half of that 1.2 billion person market). Instead of 5% of page navigations we are logging 100% of them. This would put us at roughly 30x more telemetry data points having to be managed than Facebook having to manage a day's worth of responses to their entire user base. This is just a beginning of a web scale feature. We don't get the luxury of there being millions of sites that get to distribute the load, instead all of the data from all of those users has to slowly hit our endpoints and its very unique, uncacheable data.

Needless to say, we don't upload all of it, nor can we. You can opt out of data collection and many people do. We will also restrict our sampling groups for various reasons to limit the data feeds to an amount that can be managed. But imagine there is a rogue actor in the system, maybe a web browser that is new that doesn't have years of refinement on its telemetry points. You could imagine such a browser over logging. In fact, to be effective in the early times where your browser is being rolled out, you have to log more and more often to get enough data points while you build your user base up. You want the browser to be able to log a LOT of data and then for that data to be restricted by policies based on the amount and types of data being received before going up to the cloud.

Cool, so that is a very long winded way to introduce my telemetry quality or LOD meter. Basically, when you are writing telemetry, how much thought/work should you put into it based on the audience that it will be going to and of what size is that audience. As you scale up and you want to roll out to say, every Windows 10 user, then something as innocuous as a string formatting swprint might have to be rethought and reconsidered. The following figure shows, for my team, what our considerations are when we think about who we will be tapping to provide our data points for us ;-)


I can also accompany this with a simple table that maps the target audience to the various points that change as you slide from the left of the scale to the right. From left to right the columns are:

  • Audience - From the figure above who is going to be running the bits and collecting data.
  • Code Quality - How much thought has to be put into the code quality?
  • Code Performance - How much performance impact can the code have?
  • Output Formatting - How verbose can the data be and how can it be logged?
  • Logging Data Size - How much data can be logged?
  • Logging Frequency - Can you log every bit of data or do you have to start sampling?

Note many of these are interrelated. By changing your log data size, you might be able to increase your frequency. In production, you tend to find that the answer is, "yes, optimize all of these" in order to meet the desired performance and business requirements. Also note that as you get to release, the columns are somewhat additive. You would do all of the Beta oriented enhancements for Release as well as those specified for the Release code. Here is the table with some of my own off the cuff figures.

Audience Quality Performance Output Log Size Log Frequency
Developer Hack Debug Perf Strings and Files GBs Every Call
Team Doesn't Crash Debug Perf Log Files GBs Every Call
Internal Reviewed 1.2-1.5x Log Files/CSV GBs Aggregated
Beta Reviewed & Tested 1.1x String Telemetry <MBsAggregated+Compressed
Release Optimized ~1x Binary Telemetry <5KBAgg+Sampled+Compressed

Hopefully it is clear from the table that to build a developer hack into your system you can get away with murder. You can use debug builds with debug performance (some debug builds of some products can be greater than 2x-5x slower than their retail counterparts) using debug string formatting and output, maybe write it to a file, but maybe just use OutputDebugString. You can log gigs of data and you can most importantly log everything, every call, full fidelity. In this mode you'll do data aggregation later. 

The next interesting stage is internal releases. This might be to a broader team of individuals and it may also include using web crawlers, performance labs, test labs, etc... to exercise the code in question. Here we have to be more mindful of performance, the code needs to have a review on it to find stupid mistakes, and you really need to start collecting data in a well formatted manner. At this point, raw logs start to become normalized CSVs and data tends to be aggregated by the code before writing to the logs to save a bit more on the output size. You can still log gigs of data or more at this point though, assuming you can process all of it. You also probably want to only enable the logging when requested, for instance via an environment variable or by turning on a trace logging provider (ETW again, if you didn't follow that link you should, ETW is our preferred way of building these architectures into Windows).

Depending on your scale, Beta and Release may have the same requirements. For us they tend to, since our beta size is in the millions of users and most beta users tend to enable our telemetry so they can give us that early feedback we need. Some companies ship debug builds to beta users though, so at this point you are just trying to be respectful of the end users machine itself. You don't want to stores gigs of log data, you don't want to upload uncompressed data. You may choose not to upload binary data at this point though. In fact having it in viewable format for the end user to see can be a good thing. Some users appreciate that. Others don't, but hey, you can't make everyone happy.

Finally when you release, you have to focus on highly optimized code. At this point your telemetry should have as close to 0 as possible on the performance marks for your application. Telemetry is very important to a product, but so is performance, so finding your balance is important. In a browser, we have no spare time to go collecting data, so we optimize both at the memory level and the CPU level to make sure we are sipping at the machine's resources and leaving the rest to the web page. You'll generally want to upload binary telemetry, in small packets, highly compressed. You'd be surprised what you can do with 5KB for instance. We can upload an entire page's worth of sampled DOM profiler information on most pages. More complex pages will take more, but that is where the sampling can be further refined. I'll talk a bit about some of these considerations now.

DOM Telemetry

Okay, so for DOM information how can we turn the knobs, what is available, what can we log? We decided that a sampled profiler would be best. This instruments the code so that some small set of calls as we choose will have timing information taken as part of the call. The check for whether or not we should log needs to be cheap as does the overhead of logging the call. We also want some aggregation since we know there are going to be thousands of samples that we'll take and we only want to upload those samples if we aren't abusing the telemetry pipeline.

A solution that used a circular logging buffer + a sampled API count with initial random offset was sufficient for our cases. I apologize for slamming you with almost ten optimizations in that one sentence, but I didn't feel going through the entire decision tree that we did would be useful. This is the kind of feature that can take longer to design than code ;-)

Let's start with sampling. We built this into the accumulator itself. This meant that any CPU overhead with logging could be eliminated whenever we weren't sampling (rather than having sampling accept or reject data at a higher level). Our sampling rate was a simple counter. Something like 1 in every 1000 or 1 in every 10000. By tweaking the number to 1, we could log every call if we wanted to making it a call attributed profiler. From my hack I did build a call attributed profiler instead, since I wanted more complete data and my collection size was a small set of machines. The outcome of that effort though showed to do it right you would need to aggregate, which we aren't doing in this model. Aggregation can cost CPU and we can defer that cost to the cloud in our case!

With a simple counter and mod check we can now know if we have to log. To avoid a bias against the first n-1 samples, we start our counter with a random offset. That means we might log the first call, the 50th call, whatever, but then from there it is spaced by our sampling interval. These are some of the tricks you have to use when using sampling otherwise you might miss things like bootstrapping code if you ALWAYS skip the first sampling interval of values.

When logging we take the start and end QPCs (QueryPerformanceCounter values), do the math and then log the values. On 64-bit, we can submit a function pointer (this is the DOM function) the QPC delta and a few flags bits to the circular buffer and continue on. We don't even bother decoding the function pointers until we are in the cloud where we marry the data with symbols. I can't recall but we also decided at some point that we would send down the value of the QueryPerformanceFrequency down in the payload so we could do the math on that in the cloud as well. We might have decided against that in the end, but you can clearly see the lengths we go to when thinking about how much CPU we use on the client's machine.

The next knob we have is the circular buffer size and the logging frequency. We allow ourselves to log the first buffer during a navigation and then 1 more buffer every minute. If the buffer isn't full we log a partial buffer. If the buffer overflows then we simply lose samples. We never lose samples in the initial navigation buffer since we always commit it when its ready and then put ourselves on a future logging diet.

Once this data hits the Windows telemetry service, it gets to decide if this users is opted into this type of logging. So we MIGHT in some cases be tracking things that don't make it up to us. We do try and detect this beforehand, but we can't always do this. There are things like throttling that would decide if buffer should go up or no. Once we hit production, which we did in our first Windows 10 update release back, then scale kicks in and you don't even concern yourself with the missing data because you have WAY TOO MUCH data to deal with already!

The Windows telemetry pipeline also controls for many other variables which I'm not tuned into. There is an entire data science team which knows how to classify the machines, the users, the locale, and a bunch of other information from each Windows machine and then those become pivots that we can sometimes get in our data. We can certainly get details on domains and URLs once we have enough samples (to anonymize the data there must be a sufficient number of samples, otherwise we can end up seeing PII without realizing it).

Okay, I'm starting to get into the data itself so let's take a look at some of the insights this effort has brought to our attention!

Web API Insights

There are two schools of thought in data science. Ask a specific question and then attempt to answer it with some telemetry. This is a very focused approach, it often yields results, but it rarely creates new questions or allows for deep insight. For the second approach, when we think about "big data" as opposed to "data science" we start to think about how our raw data has deeply buried patterns and insights for us to go glean. Its rarely this clean, but there are indeed patterns in that raw data, and if you have enough of it, you definitely start asking more questions ;-) Our second school of thought then wants to add telemetry to many things with no specific question, then process the data and see if anything pops out.

Our Web API telemetry design is both. First, we did have some very specific questions and our questions were around things like, "What are the top 10 DOM APIs by usage?" and "What are the top 10 DOM APIs by total exclusive time?". These are usage and performance questions. We didn't start by thinking about other questions though like, "What APIs are the top 10 websites using today that is different from 3 months ago?" How could we ask a time oriented question requiring many data points without having the first data point? Well, by collecting more raw data that didn't have specific questions in mind just yet, we can ask some of those questions later, historically if you will, and we can run algorithms to find patterns once we have additional data.

One of our biggest outcomes from the hackathon data was using a clustering algorithm to cluster the sites into 10 categories based on their API usage. Would you have guessed that 700 websites out of the top 1000 would be categorized and appear similar to one another? I wouldn't have.

Here are some insights that we were able to derive. I'm, unfortunately, anonymizing this a little bit but hopefully in the future we'll be able to broadly share the data similar to how Chrome and FireFox are doing through their telemetry sites.

Insight #1: Upon initial release of our feature, we found that our numbers were heavily skewed towards URL's in a specific country that we didn't expect to be super high. We found, using this method, an indirect correlation between upgrade cadence and country. After a couple of weeks this completely evaporated from our data and we started to see the site distribution that we more traditionally expected.

Insight #2: Our crawler data only had about a 60-70% overlap with our live data. This meant that what people do on the web changes quite a bit between their initial navigates and when they start to interact with the page. Our crawler was blind to big sites where people spend a lot of time and do a lot of interactions. All of those interactive scenarios were only "marginally" hit by the crawler.

This means that some APIs not on our performance optimization list started to jump up the list and became important for our team. We also started to extrapolate use cases from the data we were seeing. As an immediate example, APIs like setTimeout started to show up more since that is how dynamic pages are written. requestAnimationFrame was the same. All of the scheduling APIs moved up the list a bit when we considered the live data and presented differently than the crawler did. This was great news.

Insight #3: Even though I just talked down the crawler, it turns out, it isn't THAT far off. Since we know its shortcomings we can also account for them. We use the crawler to validate the live data (does it make sense?) and we use the live data to validate the crawler (is it still representative of the real world). Having two different ways to get the same data to cross validate is a huge bonus when doing any sort of data science projects.

Insight #4: The web really needs to think about deprecation of APIs moving forward. The power of the web is becoming the ability for the run-time and language to adopt to new programming trends in months rather than years. This has the downside of leading to a bloated API set. When APIs are no longer used by the web we could try to work towards their deprecation and eventual removal. Given the use trackers of Chrome, FireFox and Microsoft Edge this can become more than just a hope. If we consider that Internet Explorer is supporting the legacy web on Windows platforms and filling that niche roll of keeping the old web working I see even more hope.

What we classically find is that something like half of the web API is even used. Removing APIs would improve perf, shrink browser footprint and make space for newer APIs that do what web developers actually want them to do.

Insight #5: My final insight is one that we are only beginning to realize. We are collecting data over time. FireFox has an evolution dashboard on their site and hear I'm linking one where they explore, I think, UI lags in the event loop and how that changes over time.

Why do overtime metrics matter for the browser? Well, by watching for usage trends we can allocate resources towards API surface area that will need it most in the future. Or we can focus more on specifications that extend the areas where people are broadly using the API set. A great example would be monitoring adoption of things like MSE or Media Source Extensions and whether or not the browser is supporting the media APIs necessary to deliver high quality experiences.

We can also determine if architectural changes have materially impacted performance either to the positive or negative. We've been able to "see" this in some of our data though the results are inconclusive since we have too few data points currently. By logging API failures we can take this a step further and even find functional regressions if the number of failures increases dramatically say between two releases. We don't yet have an example of this, but it will be really cool when it happens.

Conclusions

After re-reading, there is a LOT of information to digest in this article. Just the section on the telemetry LOD could be its own article. The Web API data, I'm sure, will be many more articles to come as well. We should be able to make this available for standards discussions in the near future if we haven't already been using it in that capacity.

The most stand-out thought for me as a developer was that going from Hackathon to Production was a long process, but not nearly as long as I thought it would be. I won't discount the amount of work that everyone had to put in to make it happen, but we are talking about a dev month or two, not dev years. The outcome from the project will certainly drive many dev years worth of improvements, so in terms of cost/benefit it is definitely a positive feature.

Contrasting this with work that I did to instrument a few APIs with use tracker before we had this profiler available, I would say the general solution came out to be much, much cheaper. That doesn't mean everything can be generally solved. In fact, my use tracker for the APIs does more than just log timing information. It also handles the parameters passed in to give us more insight into how the API is being used.

In both cases adding telemetry was pretty easy though. And that is the key to telemetry in your product. It should be easy to add, easy to remove and developers should be aware of it. If you have systems in place from the beginning to collect this data, then your developers will use it. If you don't have the facilities then developers may or may not write it themselves, and can certainly write it very poorly. As your product grows you will experience telemetry growing pains. You'll certainly wish you had designed telemetry in from the start ;-) Hopefully some of the insights here can help you figure out what level of optimization, logging, etc... would be right for your project.

Credits

I'd like to provide credit here to the many people who ended up helping with my efforts in this space. I'll simply list first names, but I will contact each of them individually and back fill their twitter accounts or a link to a blog if they want.

Credit for the original design and driving the feature goes to my PM Todd Reifsteck (@ToddReifsteck) and our expert in Chakra who built the logging system, Arjun.

Credit for all of the work to mine the data goes mainly to one of our new team members Brandon. After a seamless hand-off of the data stream from Chakra we have then merged it with many other data streams to come up with the reports we are able to use now to drive all of the insights above.